| Compound Info | |||||||||||||
|---|---|---|---|---|---|---|---|---|---|---|---|---|---|
| NAs | Base Info | ||||||||||||
| ID | Cluster | Name | Target | MolWt | |||||||||
|
NAs.000230 | 2 |
|
437.263 | |||||||||
| Chemical Representations | |
|---|---|
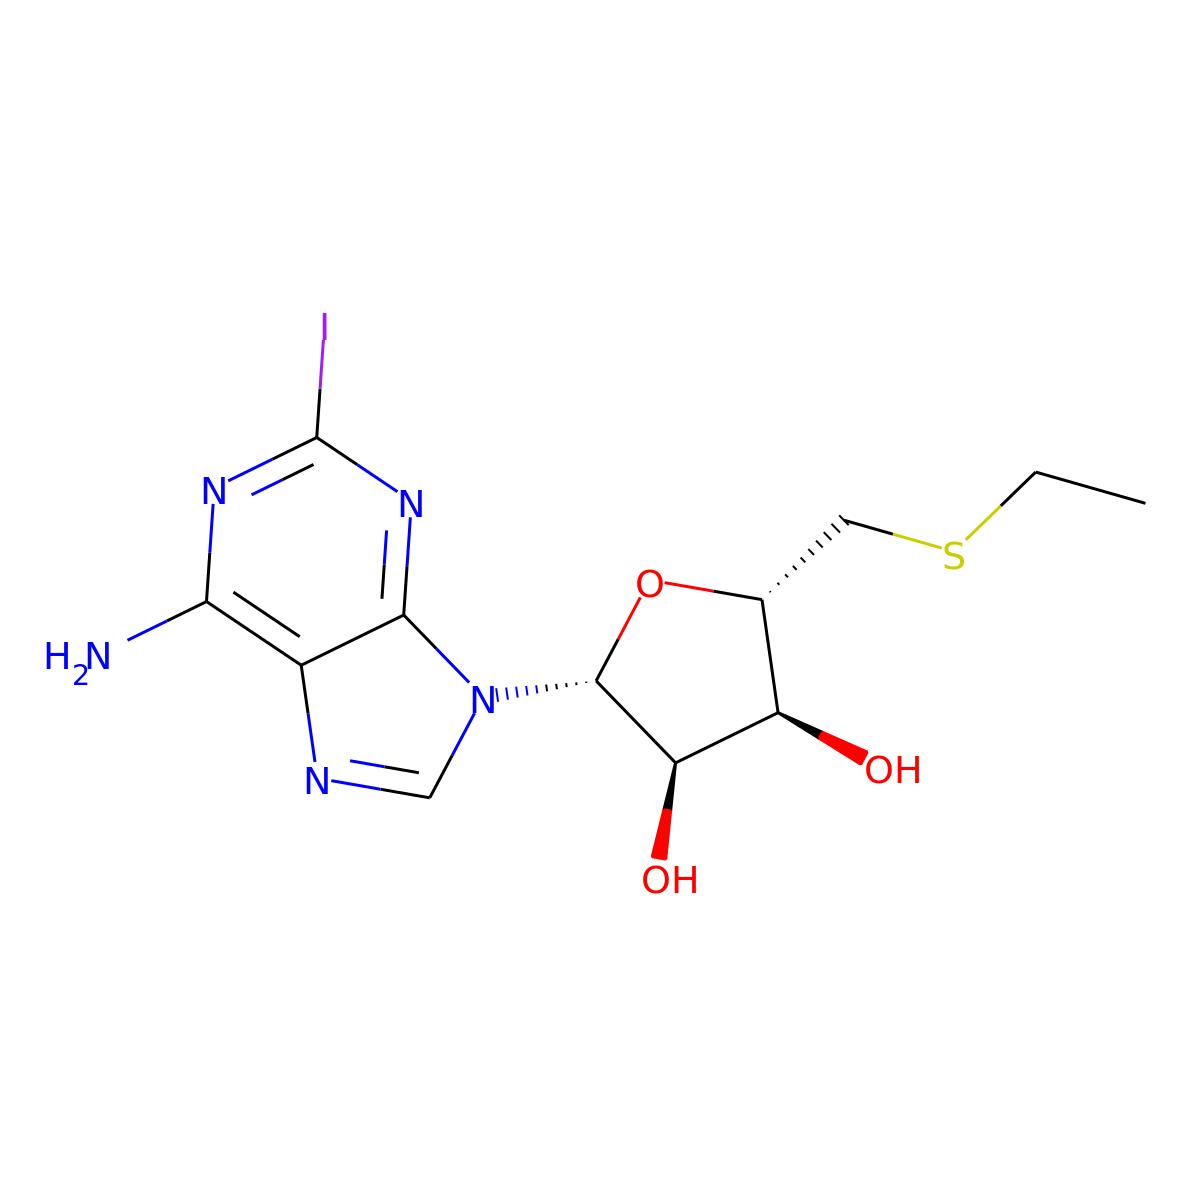
| InChI | InChI=1S/C12H16IN5O3S/c1-2-22-3-5-7(19)8(20)11(21-5)18-4-15-6-9(14)16-12(13)17-10(6)18/h4-5,7-8,11,19-20H,2-3H2,1H3,(H2,14,16,17)/t5-,7-,8-,11-/m1/s1 |
| InChI Key | KNTRGNQLWHTVLA-IOSLPCCCSA-N |
| SMILES | CCSC[C@H]1O[C@@H](n2cnc3c(N)nc(I)nc32)[C@H](O)[C@@H]1O |
| Molecular Formula | C12H16IN5O3S |
| Functional Fragments | ||
|---|---|---|
| Base | Ribose | Phosphate |
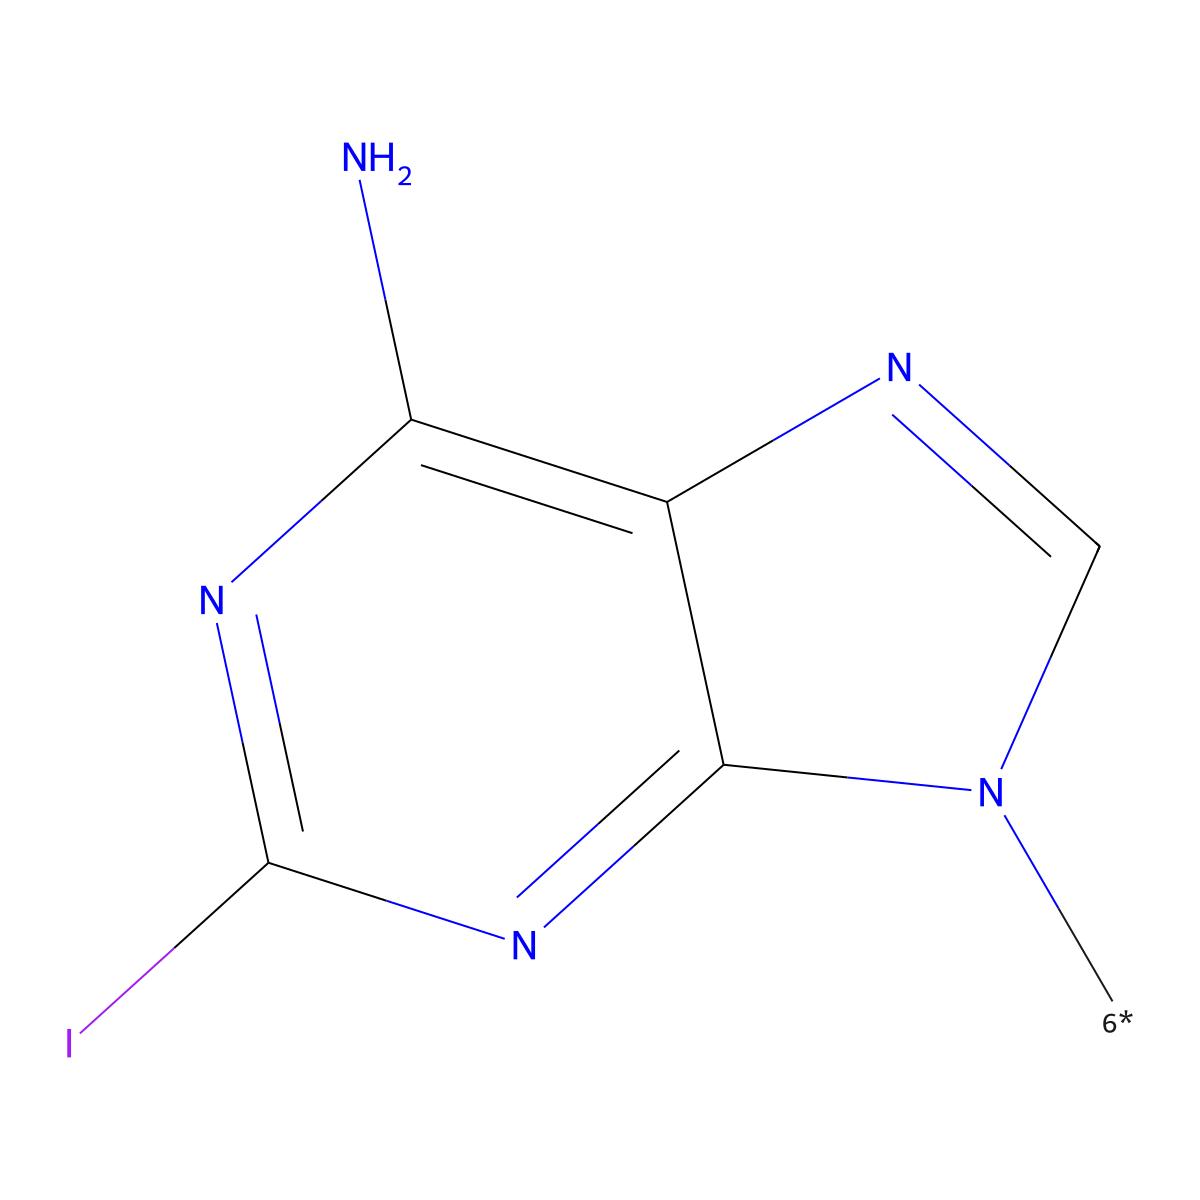
Match
|
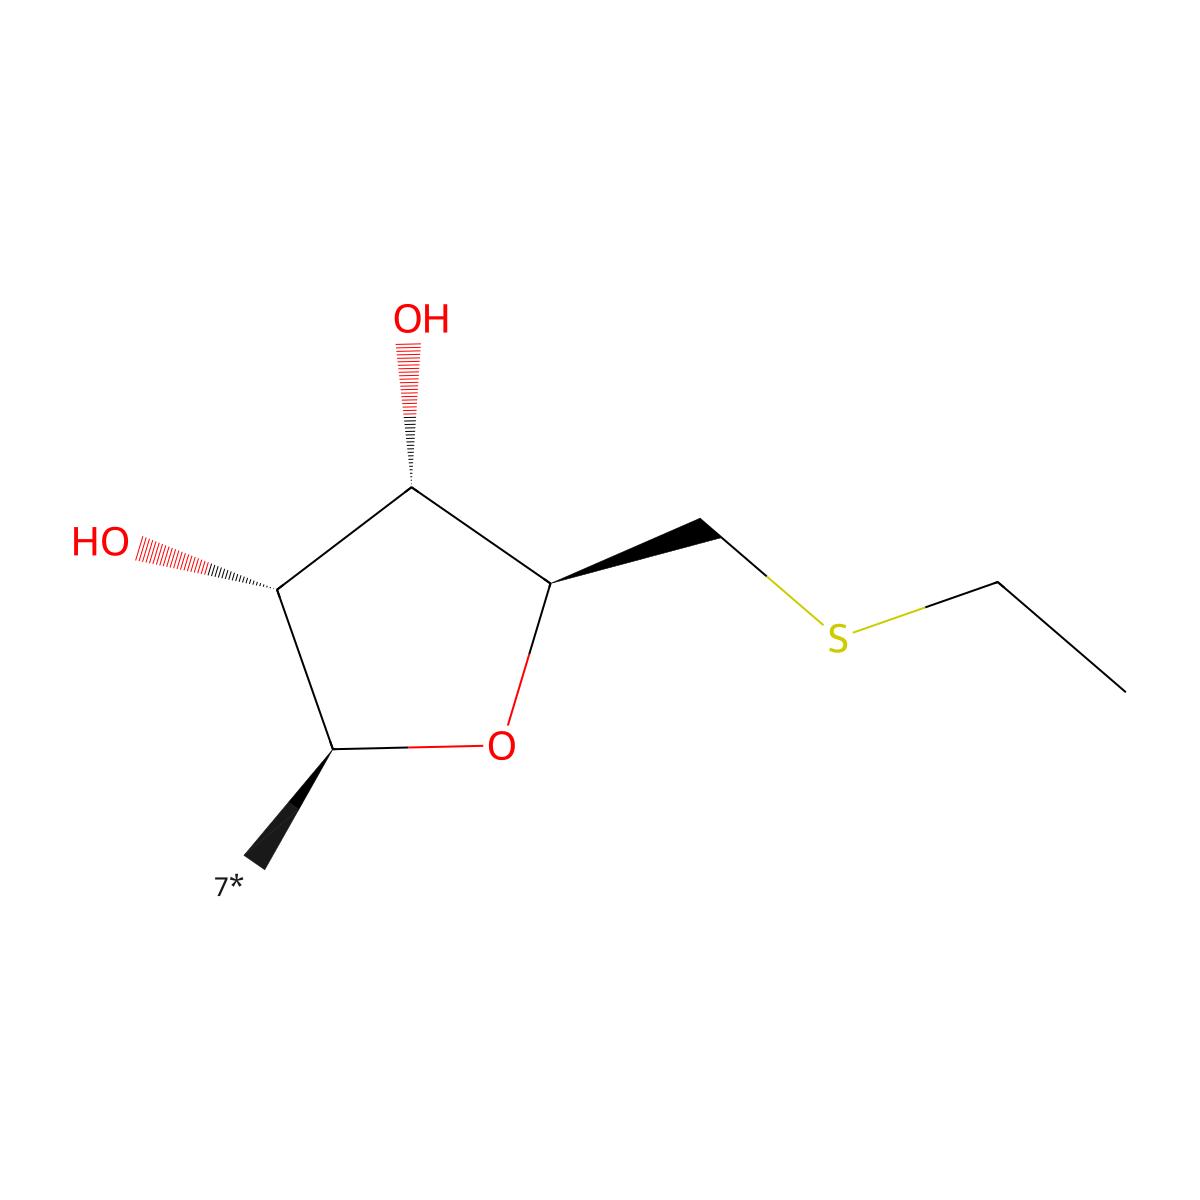
Match
|

|
| Calculated Properties | ||
|---|---|---|
| logP | 0.385 | Computed by RDKit |
| Heavy Atom Count | 22 | Computed by RDKit |
| Ring Count | 3 | Computed by RDKit |
| Hydrogen Bond Acceptor Count | 9 | Computed by RDKit |
| Hydrogen Bond Donor Count | 3 | Computed by RDKit |
| Rotatable Bond Count | 4 | Computed by RDKit |
| Topological Polar Surface Area | 119.310 | Computed by RDKit |
| Activity Data | ||||||
|---|---|---|---|---|---|---|
| Target | Activity type | Relation | Value | Unit | Assay | Source |
| Adenosine A1 receptor | Ki | = | 386.0 | nM | Ability to displace [3H]DPCPX from Adenosine A1 receptor in rat cortical membrane | CHEMBL1135807 |
| Adenosine A2a receptor | Ki | = | 1200.0 | nM | Binding affinity at Adenosine A2A receptor in rat striatal membrane by [3H]ZM-241385 displacement. | CHEMBL1135807 |
| Adenosine A3 receptor | Ki | = | 395.0 | nM | Binding affinity at human Adenosine A3 receptor expressed in HEK 293 cells by [125I]-AB MECA displacement. | CHEMBL1135807 |
| Adenosine A2a receptor | Emax | = | 100.0 | % | Maximum level of G-protein activation (Emax) compared to CGS 21680 through Adenosine A2A receptor expressed in CHO cells using cAMP assay | CHEMBL1135807 |
| Adenosine A3 receptor | Emax | = | 14.0 | % | % inhibition of forskolin induced (10 uM) cAMP production compared to C1-IB-MECA through Adenosine A3 receptor expressed in CHO cells at 30 uM | CHEMBL1135807 |